 rus
rus
 eng
eng
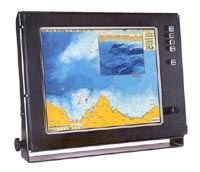
Charts system Olex 3D
Olex ties vector chart data, seafloor data, plotter objects and radar targets together to a single display. Such combination guarantees safe navigation and more efficient fishing.
Chart system combines possibilities of navigation according to vector chart data, making fishing plane-tables and 3D views of depth contour relief.
Innovation method for seafloor mapping. Olex constructs seafloor charts through realtime data from the echosounder and GPS. For every measured depth the chart gets more accurate. The seafloor calculation is a continuous and fully automatic process. There is no particular limit to the amount of seafloor data to be handled.
Shows how the bottom look like. Various 3D views give a clear understanding of the topology. Several 2D modes such as relief, depth contour and bottom zoom, each highlights both flat and complex terrain. The system can even calculate the volume and area of surveyed water surface.
It is easy to store marks, comments, lines and areas. Track lines of both radar targets and own vessel can be colored according to choice. The plotter data is organized into individually named plot layers, making it easy to distinguish different types of data.
Users of Olex are encouraged to share their seafloor data making global chart system of water depth. Chart data made by one vessel can be given to another vessels on diskettes. So the general ocean chart is created. Traditional plotter data like marks and tracks can also be shared.
Technical specifications
| Parameters, function | Values |
| Marine chart system: Norwegian drainage service C-MAP charts Official electronic charts |
S57 and NSKV format СМ93 format IC-ENC, NOAA, Primar Stavanger, ChartWorld |
| Electronic chart managing | With a help of keyboard and mouse |
| Modes of bottom reflection | 2D map - flat reflection 3D map - volume reflection |
| Registration and record of water temperature | From - 5° to + 30° С |
| Modes of transferring data to autopilot | According to track spots According to route |
| Consideration of undercurrent influence | Automatic |
| Connecting of outward equipment | Autopilot,GPS, Echosounder, Gyro, Radar Compass, temperature sensor, AIS |
| Additional functions and opportunities | Bottom solidity determination 3D views presentation and trawl positioning (ITI) |
| Highlighting of objects on a chart | Animated lights and sectors |
| Color marking of bottom solidity | From brightly rose (mild bottom) Till brightly yellow (solid bottom) |
| Manu language | English, German, French, Norwegian, Spanish |
| Display requirements | Resolution not less than 1024 х 768 pixels, 70 Hц |
A scope of delivery:
- Display;
- A set of mounting tools.